# Dashboard
Want to see Polaris results for all your clusters in a single dashboard? Check out Fairwinds Insights (opens new window)
The Polaris dashboard can be installed on a cluster using kubectl or Helm. It
can also be run locally, connecting to your cluster using the credentials stored in your KUBECONFIG.
The dashboard is a good way to understand what workloads inside your cluster or Infrastructure as Code don't conform to best practices.
# Installation
# Helm
helm repo add fairwinds-stable https://charts.fairwinds.com/stable
helm upgrade --install polaris fairwinds-stable/polaris --namespace polaris --create-namespace
kubectl port-forward --namespace polaris svc/polaris-dashboard 8080:80
# Local Binary
You'll need a valid KUBECONFIG set up for the dashboard to connect to your cluster.
Binary releases can be dowloaded from the releases page (opens new window) or can be installed with Homebrew (opens new window):
brew tap reactiveops/tap
brew install reactiveops/tap/polaris
polaris dashboard --port 8080
You can also point the dashboard to the local filesystem, instead of a live cluster:
polaris dashboard --port 8080 --audit-path=./deploy/
# Local Docker container
docker run -d -p8080:8080 -v ~/.kube/config:/opt/app/config:ro us-docker.pkg.dev/fairwinds-ops/oss/polaris:1.2 polaris dashboard --kubeconfig /opt/app/config
# Using the Dashboard
The Polaris dashboard is a way to get a simple visual overview of the current state of your Kubernetes workloads as well as a roadmap for what can be improved. The dashboard provides a cluster wide overview as well as breaking out results by category, namespace, and workload.
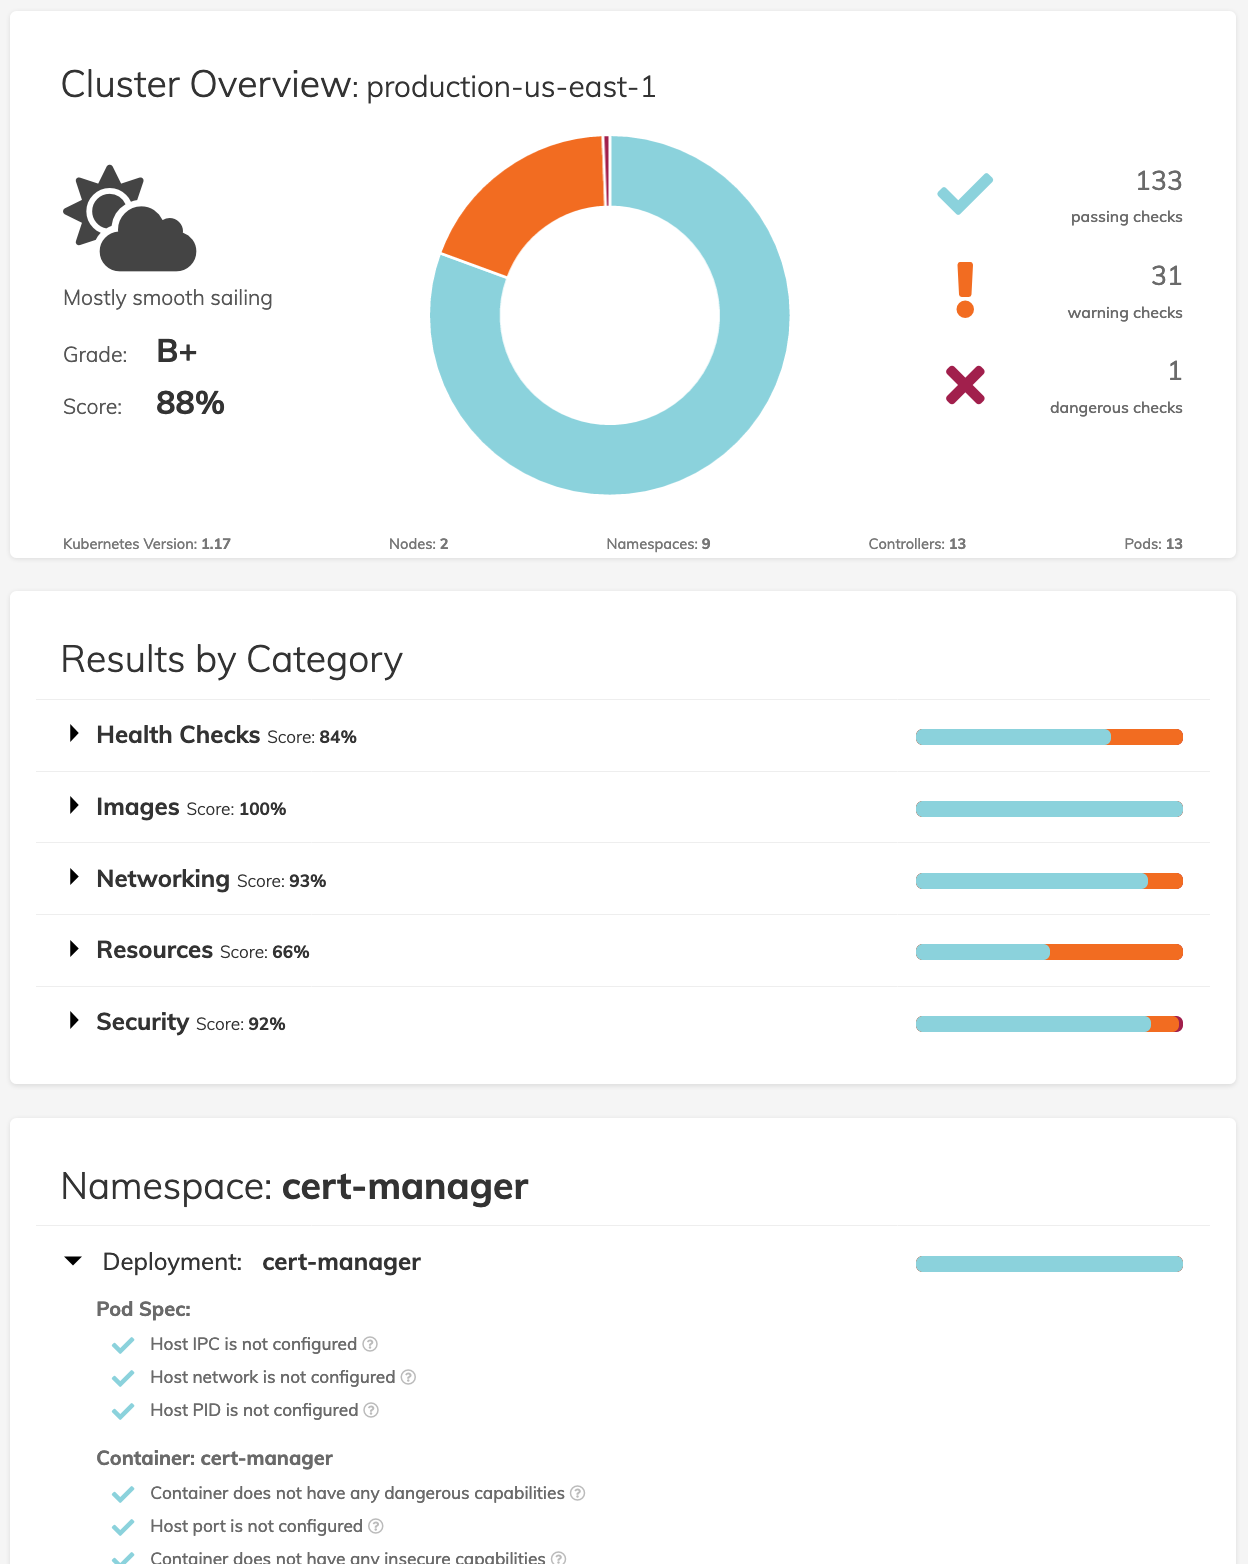
Our default standards in Polaris are rather high, so don’t be surprised if your score is lower than you might expect. A key goal for Polaris was to set a high standard and aim for great configuration by default. If the defaults we’ve included are too strict, it’s easy to adjust the configuration as part of the deployment configuration to better suit your workloads.